Home " Software " 3Muri Project " FME - Global Analysis.
3Muri Project: FME - Global Analysis
Up-to-date masonry construction requires the highest competence in design and calculation of structures in seismic zones.
To assist and support the designer in this task, S.T.A. DATA offers 3Muri Project, developed specifically for masonry.
In fact, it is not a generic Finite Element software adapted for masonry structures; 3Muri Project was born out of specific research for these structures and captures all their characteristics to achieve safe and reliable results.
Adaptable to both new and historic single or aggregate buildings of all sizes, 3Muri Project performs the function of making them solid and safe even in the event of seismic events. An indispensable software, now so ingrained in the design culture that it is now in its thirteenth version.
Its trump card? The innovative FME (Frame by Macro Elements) calculation method.
To develop it, we collaborated with the research team led by Prof. Sergio Lagomarsino, Professor of Construction Technology at the University of Genova together with other specialists (Prof. Andrea Penna and Eng. Alessandro Galasco of Eucentre in Pavia, and Eng. Serena Cattari of the University of Genoa)
The theoretical foundations of 3Muri Project are derived from laboratory experiments and analyses of real structures, which, coupled with a system of modelling and consulting of the results, make 3Muri Project a software at the top of its class.
Validation comes from numerous national and international universities and research centres, which chose 3Muri Project to carry out tests. The result? Total efficiency and reliability, deduced from the positive comparison between the seismic effects on real structures damaged by recent earthquakes (L'Aquila and Emilia) and numerical results.
The numerous configurations in which 3Muri Project is offered meet all the needs of designers, from the most complex to the simplest structures.
The analysis of the structure at 3muri is divided into two phases: first, the equivalent frame model is automatically generated, second, the non-linear static analysis (push-over) is performed, from which the capacity curve of the structure (stress-displacement of the control node curve) is obtained.
The result of generating the equivalent frame model is the presentation of a mesh that schematizes the structure into piers, lintels, beams, tie rods and columns. These elements can still be modified manually to take into account special situations.
The non-linear analysis, on the other hand, is conducted by monotonically increasing the loads and obtaining the horizontal displacement of the structure. When a conventional displacement value, which is calculated automatically, is exceeded the structure is considered collapsed and the Horizontal Force - Horizontal Displacement curve can be constructed, which represents the offered capacity curve, i.e. the behavior of the structure as the horizontal loads vary.
The software 3muri allows the automatic determination of the equivalent frame, once the geometry of the building has been defined, through an algorithm that recognises the connections between the wall panels and subdivides them into rigid elements, piers, lintels and creating the structure to be analysed.
Thanks to an advanced meshing engine, designed specifically for masonry, even very complex situations can be examined, with results that are always correct and reliable.
Next, an automatically schematized structure is presented with the equivalent frame, i.e. with the automatic determination of piers, lintels and rigid elements, where openings, neighboring walls and external constraints are taken into account.

3Muri allows interoperability with the BIM methodology through the IFC (Industry Foundation Classes) format, whose specifications are based on a neutral data format specifically designed to describe, exchange and share project information.
3Muri provides the import of geometries from IFC models using the BIM Inside application, which is included in the module. In this way, the geometries of the objects can be used for the construction of the model.

For each analysis, the push-over curve and the bilateral schematic of the equivalent system are presented. Depending on the chosen standard, the corresponding verification conditions are displayed.
Any parameter of the building's response can be examined in order to gain an adequate understanding of the structural behaviour. These data are necessary to better plan any adaptation or improvement intervention to seismic actions.

Representation of the stress-strain curve
The limit of the curve to the right indicates the displacement provided by the structure. The vertical red bar indicates the minimum displacement required by the standard.

If this value is lower than the right limit of the curve, the structure is verified. If, on the other hand, the structure is not verified, improvements can be made by reinforces concrete layer or injections, or by inserting new elements with different materials, e.g. reinforced concrete walls, beams, columns, tie beams, tie rods.
Working this way, it is no longer necessary to check individual elements, as their contribution is implicitly taken into account when analyzing the entire structure.
The model 3Muri, through the study of the elasto-plastic behaviour of the elements, makes it possible to evaluate the conditions of the individual elements and of the overall structure at each instant. Verification is therefore obtained in terms of performance, i.e. , of the capacity of the structure to undergo displacements greater than those required by the standard.
Results

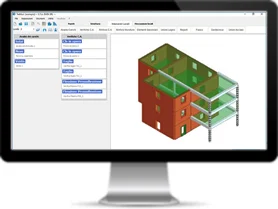
The progress of the distorted wall and level plan, is also displayed and different colours highlight the progress of the damage on the macro-elements. By observing the colour in the distorted wall map, it is easy to determine the damaged macro-elements and their cause of damage (shear, axial bending).
For all undamaged elements, it is also possible to assess the tendency of damage, distinguishing whether they enter the plastic field by shear or by bending. This type of visualisation not only concerns masonry elements but also those made of reinforced concrete, steel or wood.
This tool, shows great potential for the management of possible retrofitting of existing buildings, as it proves to be very effective for the identification of areas in which to intervene.
Non-linear static analysis (pushover) is commonly known as global building analysis. All global analyses require the building to have good "box-like" behaviour.
Sometimes, design practice confronts us with cases where the limited stiffness of floors on portions of the structure can have an important influence on the overall behaviour of the building.
Walls connected to the structural context through floors of limited stiffness may necessitate the leveraging of individual walls.
A new function allows to graphically select one or more walls to be verified. For each wall, software automatically generates 4 analyses to take into account the 2 directions for 2 different load distributions.